
Wetter Mallorca · Independent weather site
Climate table for Mallorca: temperatures, rain and sea by month
The climate table shows for each month how warm it gets in Palma de Mallorca, how cool the nights are and how much rain falls. It is based on 15 years of daily values from one station.
Updated on 2/10/20263 min read3 Sources
Photo: Heuschrecke (Dmitry Tonkonog and Ksenia Fedosova), CC BY-SA 3.0, Wikimedia Commons
In short
The climate table for Mallorca shows averages for the years 2011 to 2025 from Palma. August is the warmest month with 30.9 °C by day, January the coolest with 16.3 °C. Most rain falls in November with 87.3 mm, least in July with 2.7 mm. Over the whole year the total is 457.0 mm.
Key points
- Warmest month in Palma de Mallorca: August with 30.9 °C by day and 23.6 °C at night.
- Coolest days in January with 16.3 °C, coolest nights in February with 8.6 °C.
- The wettest month is November with 87.3 mm and 8.1 rain days.
- The driest month is July with 2.7 mm and 0.5 rain days.
- Over the year, 457.0 mm of rain falls on 51.4 rain days.
On this page
1How to read the climate table for Mallorca
The high is the mean of all daily maximum temperatures in a month, the low is the mean of the daily minimum temperatures. A rain day is a day with at least 1 mm of precipitation. Rainfall is the mean monthly total.
All values are averages over 15 years. A single month can turn out much warmer, cooler, wetter or drier. The table describes what is usual. It is not a forecast.
2Temperatures in Mallorca through the year
The year starts mild: in January Palma reaches 16.3 °C by day on average, in February 16.4 °C. In March it is 18.1 °C, in April 20.4 °C and in May 23.5 °C.
The biggest jump is between May and June, which then has 27.8 °C. July and August are the hottest months with 30.6 °C and 30.9 °C. The nights also stay very warm then, with 23.6 °C on average in August.
Autumn cools down slowly: 28.3 °C in September, 25.1 °C in October, 20.3 °C in November. December stands at 17.8 °C.
3Rain in Mallorca: when it falls and how much
The rain is concentrated in autumn. On average 56.3 mm falls in September, 63.1 mm in October and 87.3 mm in November. With 8.1 rain days, November also has the most wet days.
The summer is dry. 14.9 mm falls in June and 2.7 mm in July. August gets 21.0 mm on only 1.5 rain days, so the rain then falls heavily on a few days.
Over the whole year Palma gets 457.0 mm, spread over 51.4 rain days.
4Sea temperature off Mallorca by month
| Month | Water °C |
|---|---|
| January | 15.4 |
| February | 14.5 |
| March | 14.7 |
| April | 16.3 |
| May | 18.9 |
| June | 22.7 |
| July | 25.7 |
| August | 26.9 |
| September | 25.9 |
| October | 23.5 |
| November | 20.0 |
| December | 17.0 |
The sea is warmest in August at 26.9 °C and coldest in February at 14.5 °C. In October the water, at 23.5 °C, is still warmer than in June at 22.7 °C.
The sea temperature comes from a different source than the air temperature: the NOAA OISST satellite analysis for open water off the Bay of Palma, averaged over 2011 to 2025. For December, 14 rather than 15 years are included, because the series has a gap. At the beach and in shallow coves the water can differ.
5Which place in Mallorca the values apply to
The air temperatures and rain values come from the Palma de Mallorca CMT station, ID SPE00119882 in NOAA's GHCN-Daily dataset. It is located at 39.5556 degrees north and 2.6264 degrees east, 3 m above sea level right on the coast, around 2.6 km in a straight line from the centre of Palma.
One station on the coast does not stand for the whole island. In the Serra de Tramuntana and inland, temperatures and rainfall can differ considerably. This analysis contains no data on sunshine duration or wind.
6Every month in Mallorca in detail
Each month has its own page with a calendar for every day: January, February, March, April, May, June, July, August, September, October, November, December.
The weather for the next few days is shown in the forecast for Mallorca. Which months suit which kind of trip is covered under best time to visit.
| Month | High °C | Low °C | Rain days | Rainfall mm |
|---|---|---|---|---|
| January | 16.3 | 8.7 | 6.0 | 42.8 |
| February | 16.4 | 8.6 | 5.3 | 37.4 |
| March | 18.1 | 10.5 | 6.1 | 37.3 |
| April | 20.4 | 12.8 | 4.7 | 32.1 |
| May | 23.5 | 15.9 | 3.0 | 25.9 |
| June | 27.8 | 20.2 | 1.7 | 14.9 |
| July | 30.6 | 23.3 | 0.5 | 2.7 |
| August | 30.9 | 23.6 | 1.5 | 21.0 |
| September | 28.3 | 21.0 | 5.1 | 56.3 |
| October | 25.1 | 17.6 | 4.9 | 63.1 |
| November | 20.3 | 13.3 | 8.1 | 87.3 |
| December | 17.8 | 10.5 | 4.5 | 36.2 |
Source: GHCN-Daily station list, station SPE00119882 Palma de Mallorca CMT (39.5556 N, 2.6264 E, 3 m), checked on 2/10/2026.
Frequently asked questions
Which month is the warmest in Mallorca?
August. In Palma the average high in August is 30.9 °C and the average low is 23.6 °C. July follows close behind with 30.6 °C by day. The basis is the years 2011 to 2025.
Which month is the coldest in Mallorca?
In Palma, January has the coolest days with an average high of 16.3 °C. February has the coolest nights with 8.6 °C on average. The two months are very close together.
In which month does it rain most in Mallorca?
In November. In Palma, 87.3 mm falls on 8.1 rain days on average in November. Next come October with 63.1 mm and September with 56.3 mm. So the rain is concentrated in autumn.
How much does it rain in Palma de Mallorca in a year?
On average over the years 2011 to 2025, Palma gets 457.0 mm of precipitation per year. It is spread over 51.4 rain days per year, meaning days with at least 1 mm. Missing measurement days are not filled in, so the total is more of a lower limit.
How warm does the sea get off Mallorca?
Off the Bay of Palma, the sea reaches its highest monthly value in August at 26.9 °C. It is coldest in February at 14.5 °C. The values apply to open water and come from the NOAA OISST satellite analysis.
Which years does the climate table for Mallorca cover?
The 15 years from 2011 to 2025. That is shorter than the 30 years that weather services use for official climate normals, but it reflects the more recent past. The table is an independent analysis and not an official climate normal.
Does the climate table for Palma apply to the whole of Mallorca?
No. The values come from a single station on the coast of Palma. For the mountains of the Serra de Tramuntana, the interior and the other coasts they are only a guide. Temperatures and rainfall there can be very different.
Sources (3)
Sources
- NOAA NCEI, Global Historical Climatology Network Daily (GHCN-Daily), checked on 2/10/2026
- GHCN-Daily station list, station SPE00119882 Palma de Mallorca CMT (39.5556 N, 2.6264 E, 3 m), checked on 2/10/2026
- NOAA OISST v2.1, daily sea surface temperature, via NOAA CoastWatch ERDDAP, checked on 2/10/2026
Written and maintained by the Wetter Mallorca editorial team. Independent site, not an official weather service.
Fits the weather
Activities in Mallorca

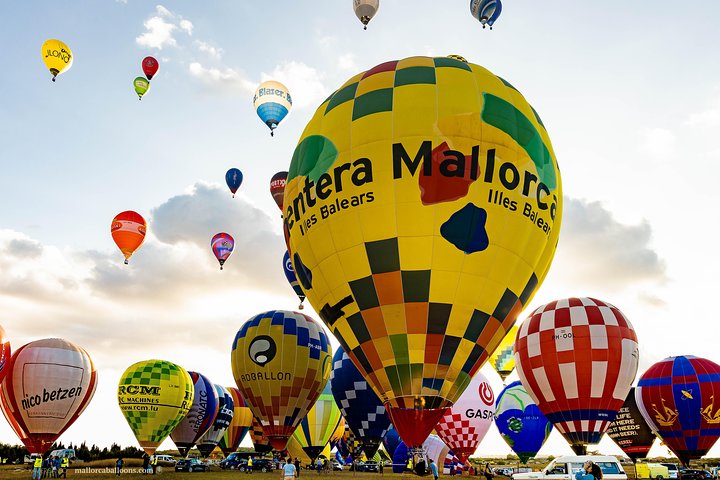
Romantic Sunrise Balloon Tour in Majorca
4 hfrom188 €
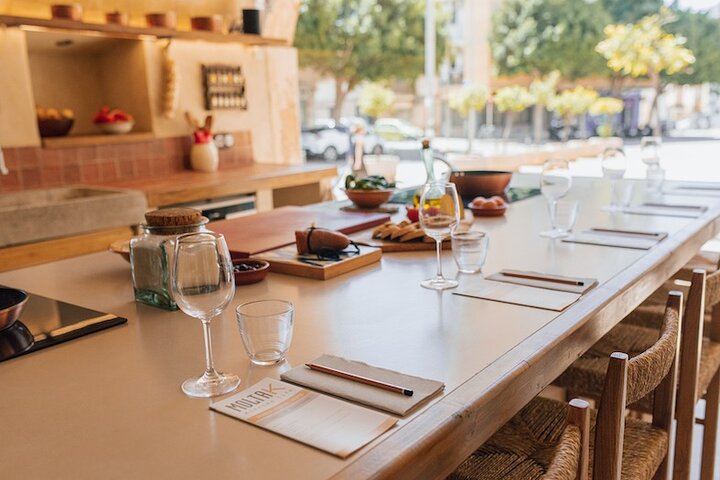
Spanish Cooking Experience in Mallorca
3 hfrom130 €
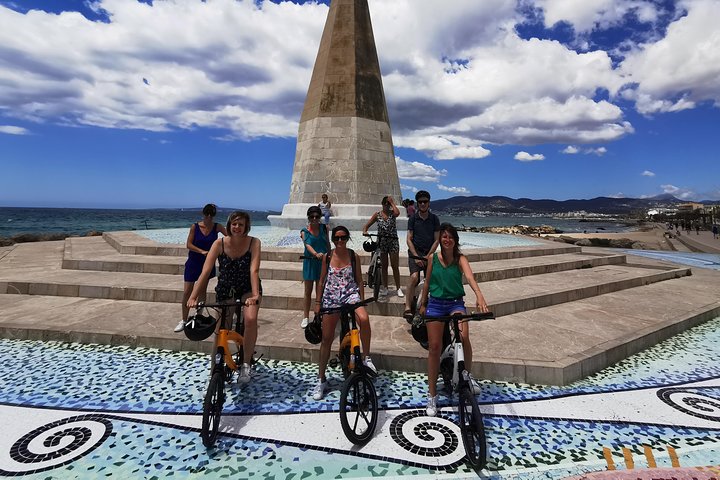
3 Hours E-Bike Tour in Palma
3 hfrom70 €
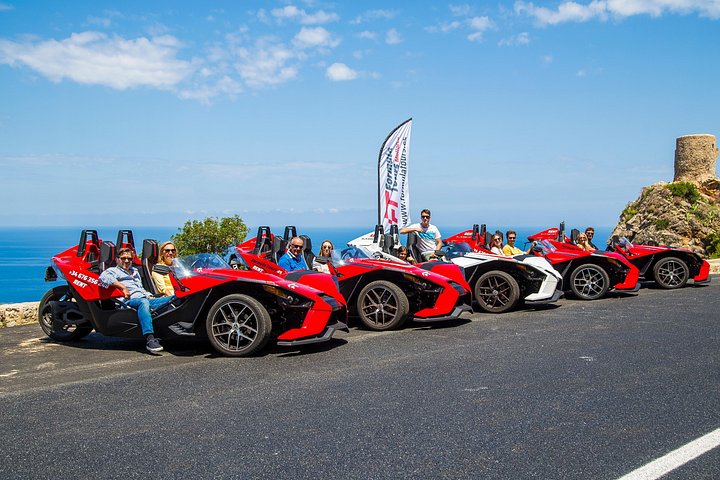
Explore Mallorca in Your Own Formula One Car
4 hfrom59 €
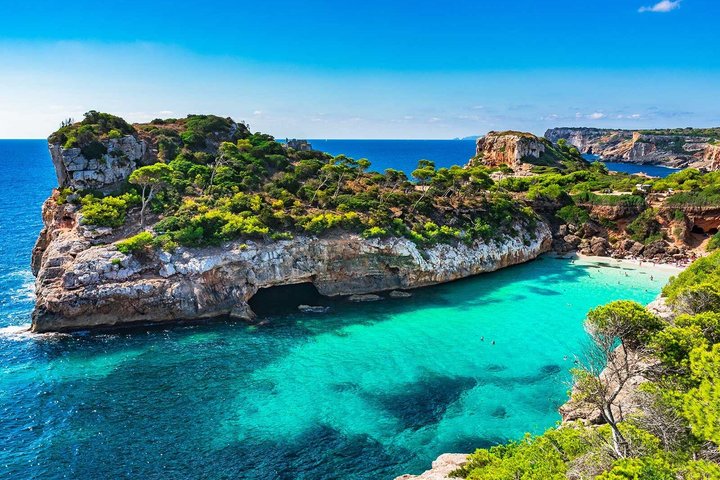
Best Mallorca Coves: Paddle Surf, Snorkeling and Guide
Full dayfrom87 €
Prices are indicative from prices set by each provider. Booking happens on Viator. We earn a commission on bookings made through these links and the price for you stays the same.
Plan
Read next
Forecast
A real weather forecast for Mallorca covers around 9 to 10 days. For days 11 to 16, this page shows what was usual on those calendar days in past year
Open →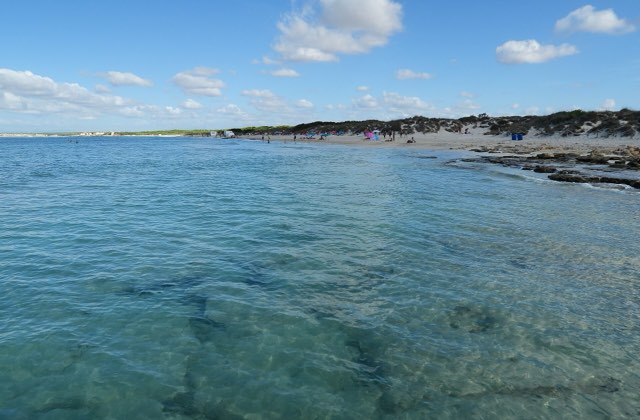
Best time to visit
There is no single best time to visit Mallorca. Which month fits depends on whether you want to swim, hike, cycle or explore Palma.
Open →
August
In Mallorca August is the hottest month and has the warmest sea of the year. Rain is rare, but it can be heavy.
Open →
November
In Mallorca November is the rainiest month of the year. Between the rain days it stays mild.
Open →About
This page is an independent information service about the weather in Mallorca. It is not an official weather service and does not belong to any public
Open →Travel planner
Plan your Mallorca holiday
Beaches, towns, markets, hikes and activities for every region of the island, with sources and a map.