
Wetter Mallorca · Independent weather site
Weather in Cala Millor: forecast, climate and sea temperature
Cala Millor lies on the east coast of Mallorca. Here you will find the forecast for the coming days and the climate of every month, measured at the nearest station of AEMET, the Spanish weather service.
Updated on 5/10/20264 min read8 Sources
Photo: Olaf Tausch, CC BY-SA 3.0, Wikimedia Commons
In short
In Cala Millor on the east coast of Mallorca, August is the warmest month with 30.3 °C by day and 20.6 °C at night. The most rain falls in November with 88.9 mm. The open sea off Cala Millor averages 26.8 °C in August. Air and rain are 2011 to 2025 averages from the AEMET Son Servera station, 3.8 km away in a straight line, the sea comes from the NOAA OISST analysis (open sea).
Key points
- The warmest month in Cala Millor is August with 30.3 °C by day and 20.6 °C at night.
- Cala Millor is coolest in February, with 16.4 °C by day and 6.4 °C at night.
- The wettest month is November with 88.9 mm on 8.7 rain days.
- The open sea off Cala Millor is warmest in August at an average of 26.8 °C, and in October at 23.4 °C it is warmer than in June at 22.5 °C.
- The forecast for Cala Millor on this page comes from MET Norway and covers around 9 to 10 days. For later days the page only shows monthly averages in the table.
On this page
1Weather forecast for Cala Millor
The forecast comes from the Norwegian weather service MET Norway, through its Locationforecast service, and applies to the coordinates of Cala Millor. It updates itself and covers around 9 to 10 days. MET Norway does not provide a forecast for longer periods. Anything further ahead is described only by the averages below, and they show what is usual, not what is coming.
| Day | Weather | High | Low | Precipitation | Wind |
|---|---|---|---|---|---|
| Monday 5 Oct | partly cloudy | 26 °C | 21 °C | 0.0 mm | 21 km/h |
| Tuesday 6 Oct | overcast | 26 °C | 20 °C | 0.0 mm | 17 km/h |
| Wednesday 7 Oct | rain showers | 24 °C | 20 °C | 18.1 mm | 29 km/h |
| Thursday 8 Oct | light rain showers | 25 °C | 18 °C | 4.7 mm | 21 km/h |
| Friday 9 Oct | fair | 21 °C | 16 °C | 0.5 mm | 22 km/h |
| Saturday 10 Oct | partly cloudy | 22 °C | 15 °C | 0.0 mm | 7 km/h |
| Sunday 11 Oct | partly cloudy | 23 °C | 15 °C | 0.0 mm | 10 km/h |
| Monday 12 Oct | sunny | 23 °C | 17 °C | 0.0 mm | 14 km/h |
| Tuesday 13 Oct | light rain showers | 24 °C | 18 °C | 1.5 mm | 18 km/h |
| Wednesday 14 Oct | fair | 25 °C | 19 °C | 0.0 mm | 12 km/h |
Data from MET Norway (Locationforecast 2.0). Data as of 5 Oct 2026, 15:19 (local time in Mallorca).
Why the forecast stops after 9 to 10 days is explained under forecast for Mallorca.
2The climate of Cala Millor month by month
| Month | Avg high | Avg low | Rain | Rain days | Avg sea |
|---|---|---|---|---|---|
| January | 16.6 °C | 6.5 °C | 63.3 mm | 6.5 | 15.3 °C |
| February | 16.4 °C | 6.4 °C | 53.9 mm | 5.5 | 14.4 °C |
| March | 17.9 °C | 8.4 °C | 35.9 mm | 5.7 | 14.5 °C |
| April | 20.0 °C | 10.1 °C | 34.9 mm | 4.7 | 16.0 °C |
| May | 23.0 °C | 12.9 °C | 24.8 mm | 4.1 | 18.5 °C |
| June | 27.5 °C | 17.0 °C | 12.9 mm | 1.9 | 22.5 °C |
| July | 30.0 °C | 19.9 °C | 4.3 mm | 0.7 | 25.5 °C |
| August | 30.3 °C | 20.6 °C | 26.7 mm | 2.3 | 26.8 °C |
| September | 27.9 °C | 18.4 °C | 57.4 mm | 6.1 | 25.8 °C |
| October | 25.0 °C | 15.2 °C | 67.7 mm | 4.7 | 23.4 °C |
| November | 20.2 °C | 11.2 °C | 88.9 mm | 8.7 | 20.1 °C |
| December | 18.0 °C | 8.0 °C | 52.3 mm | 5.5 | 17.1 °C |
Averages of past years, not a forecast. Station: Son Servera (AEMET B496X). Fuente: AEMET. Years with complete data per month: 12 to 15. Sea: NOAA OISST v2.1, open sea.
Cala Millor is warmest in August with an average of 30.3 °C by day, just ahead of July with 30.0 °C. Nights are mildest in August at 20.6 °C. In May the average high is 23.0 °C, and in October it is still 25.0 °C.
Autumn is the wettest season. September brings an average of 57.4 mm, October 67.7 mm and November 88.9 mm on 8.7 rain days. July is almost dry with 4.3 mm and 0.7 rain days. Days stay mild in winter, with 16.6 °C in January and 16.4 °C in February. Nights cool to an average of 6.4 °C in February.
3Sea temperature in the open sea off Cala Millor by month
The sea off Cala Millor is coldest in February at 14.4 °C and barely warmer in March at 14.5 °C. In April it reaches 16.0 °C, in May 18.5 °C. In June the water rises to 22.5 °C, in July to 25.5 °C and in August to 26.8 °C, the highest monthly value.
The sea stays warm in autumn, with 25.8 °C in September, 23.4 °C in October and 20.1 °C in November. In December it is still 17.1 °C, in January 15.3 °C. So the water is warmer in October than in June.
The figures apply to the open sea around 21 km east of Cala Millor in a straight line, not to the swimming spot on the beach. More on the sea around the island under sea temperature in Mallorca.
4When to go to Cala Millor, depending on what you want to do
- Swimming in warm water: In July, August and September the water off Cala Millor is 25.5 °C, 26.8 °C and 25.8 °C. July is the driest month with 0.7 rain days.
- Warm but not hot: In May days reach 23.0 °C, in October 25.0 °C. The open sea still averages 23.4 °C in October, but only 18.5 °C in May. On the other hand, October brings 67.7 mm of rain.
- Walking and cycling: In March the average high is 17.9 °C, in April 20.0 °C.
- Winter: From December to February days range between 16.4 °C and 18.0 °C, nights between 6.4 °C and 8.0 °C.
How October turns out across Mallorca is shown under Mallorca in October. Further north on the east coast lies Cala Ratjada, and every month side by side is in the Mallorca climate table.
5Where and how the Cala Millor figures are measured
Cala Millor lies on the bay of Son Servera. According to Wikipedia, the northern part of the town belongs to the municipality of Son Servera and the southern part to Sant Llorenç des Cardassar.
Air temperature and rain come from station B496X, named Son Servera, retrieved through AEMET OpenData, the data service of the Spanish weather agency. It stands at 39.6303 degrees north and 3.3836 degrees east at 25 m above sea level, 3.8 km north of the centre of Cala Millor in a straight line.
The analysis uses the daily values of the 15 years from 2011 to 2025. For temperature, July, October and December rest on 14 years, for rain July and October on 14 and November on 12 years. A rain day is a day with at least 1 mm of precipitation. This analysis contains no data on sunshine or wind.
The sea temperature comes from a different source, the NOAA OISST analysis for the grid cell at 39.625 degrees north and 3.625 degrees east. It is not a measurement on the beach. In shallow coves the water can differ.
Frequently asked questions
Which is the warmest month in Cala Millor?
August. The average high in August is 30.3 °C and the average low 20.6 °C. July follows closely with 30.0 °C by day. The figures are based on daily values from the AEMET Son Servera station for the years 2011 to 2025, for July from 14 years.
When is the sea warmest in Cala Millor?
In August, with an average of 26.8 °C. September follows with 25.8 °C and July with 25.5 °C. The sea off Cala Millor is coldest in February at 14.4 °C. The figures come from the NOAA OISST analysis for the open sea, not from the beach.
Can you still swim in Cala Millor in October?
The sea off Cala Millor averages 23.4 °C in October, more than in June at 22.5 °C. The air reaches 25.0 °C by day in October. October brings 67.7 mm of rain, the second highest total of the year, on only 4.7 rain days.
Does it rain a lot in Cala Millor in November?
November is the wettest month in Cala Millor. On average 88.9 mm falls on 8.7 rain days, meaning days with at least 1 mm. For rain in November only 12 years are available at the Son Servera station, so the figure is somewhat less certain than the others.
What is the weather like in Cala Millor in May?
In May Cala Millor reaches an average of 23.0 °C by day and 12.9 °C at night. There are 24.8 mm of rain on 4.1 rain days. The open sea off Cala Millor averages 18.5 °C in May, clearly cooler than in summer. The figures cover the years 2011 to 2025.
How cold is Cala Millor in winter?
Days in Cala Millor stay mild in winter too, with averages of 18.0 °C in December, 16.6 °C in January and 16.4 °C in February. Nights cool down more, to 6.4 °C in February. The open sea off Cala Millor averages 14.4 °C in February.
How reliable is a 16-day forecast for Cala Millor?
This page has no 16-day forecast for Cala Millor. The MET Norway data cover around 9 to 10 days. Anything further ahead can only be described with averages, and they show what is usual, not what the weather will be on a particular day.
Which municipality does Cala Millor belong to?
Cala Millor lies within two municipalities. According to Wikipedia, the northern part belongs to Son Servera and the southern part to Sant Llorenç des Cardassar. The AEMET station whose figures this page shows is named Son Servera and lies 3.8 km north of the town centre in a straight line.
Sources (8)
Sources
- AEMET OpenData, daily climate values, checked on 5/10/2026
- AEMET station inventory, station B496X Son Servera (39.6303 N, 3.3836 E, 25 m), checked on 5/10/2026
- NOAA OISST v2.1, daily sea surface temperature (NOAA CoastWatch ERDDAP), checked on 5/10/2026
- MET Norway, Locationforecast 2.0, checked on 5/10/2026
- MET Norway, Locationforecast data model and forecast models, checked on 5/10/2026
- MET Norway, licence and attribution (NLOD 2.0, CC BY 4.0), checked on 5/10/2026
- Wikipedia, Cala Millor (German edition), checked on 5/10/2026
- Wikipedia, Cala Millor, checked on 5/10/2026
Written and maintained by the Wetter Mallorca editorial team. Independent site, not an official weather service.
Fits the weather
Activities in Mallorca
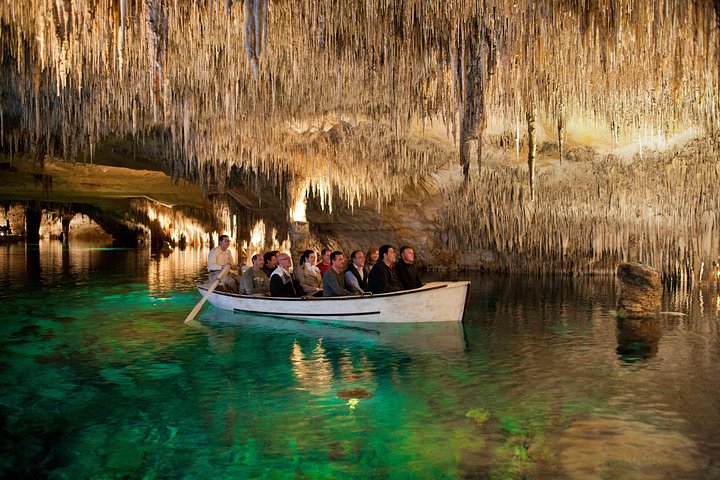



Prices are indicative from prices set by each provider. Booking happens on Viator. We earn a commission on bookings made through these links and the price for you stays the same.
Plan
Read next

October
In Mallorca October is still warm, and the sea is warmer than in June. But it is among the rainiest months.
Open →
Sea temperature
How warm the sea in Mallorca is depends mainly on the month and hardly on the coast. Here are the monthly means of the sea surface for three stretches
Open →
Cala Ratjada weather
Cala Ratjada, also spelt Cala Rajada, belongs to the municipality of Capdepera in the north-east of Mallorca. Here you find the live forecast for the
Open →
Forecast
A real weather forecast for Mallorca covers around 9 to 10 days. For days 11 to 16, this page shows what was usual on those calendar days in past year
Open →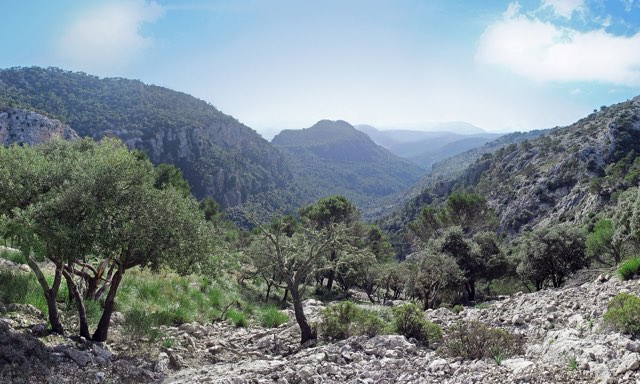
Climate table
The climate table shows for each month how warm it gets in Palma de Mallorca, how cool the nights are and how much rain falls. It is based on 15 years
Open →Travel planner
Plan your Mallorca holiday
Beaches, towns, markets, hikes and activities for every region of the island, with sources and a map.